概要
この記事では、Leafletを用いてWeb地図を表示し、その上の任意の位置に、画像を重ねて描画する方法について解説する。
例として、OpenStreetMapから取得した地図に、伊能忠敬の地図を重ねて表示してみる。
素材の取得
地図タイル
地図タイルはOpenStreetMapのものを使用する。

OpenStreetMap
OpenStreetMap is a map of the world, created by people like you and free to use under an open license.
www.openstreetmap.org
伊能図
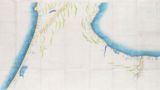
伊能忠敬が作成した伊能図は、古地図コレクションから取得できる。
今回は、能登半島と富山県の沿岸部の地図を使用した。
能登南界 加賀北界 越中 富山 | 古地図コレクション(古地図資料閲覧サービス)
国土地理院が所蔵している古地図等の地理史料一覧です
kochizu.gsi.go.jp
重ねて表示
表示結果
コード
<!DOCTYPE html>
<html>
<head>
    <meta charset="UTF-8">
    <title>Leafletで地図に画像を重ねる|艮電算術研究所</title>
    <link rel="stylesheet" href="https://unpkg.com/leaflet@1.4.0/dist/leaflet.css" />
    <script src="https://unpkg.com/leaflet@1.4.0/dist/leaflet.js"></script>
    <script>
    function init() {
        // 画像の設定
        var image_url = "img/i083.jpg";
        var bounds = L.latLngBounds(
            [36.980, 136.59],
            [36.645, 137.31],
        ); // 画像を表示する範囲(緯度経度)

        // 地図の表示
        var map = L.map('mapcontainer');
        map.setView([36.9, 137.0], 9);
        L.tileLayer('https://{s}.tile.openstreetmap.org/{z}/{x}/{y}.png', {
            attribution: "<a href='https://openstreetmap.org'>OpenStreetMap</a>"
        }).addTo(map);
        // 画像を重ねる
        L.imageOverlay(image_url, bounds, {
            attribution: "<a href='https://kochizu.gsi.go.jp/items/376'>古地図コレクション</a>",
        }).addTo(map);
    }
    </script>
</head>
<body onload="init()">
    <div id="mapcontainer" style="width:500px;height:500px"></div>
</body>
</html>
解説
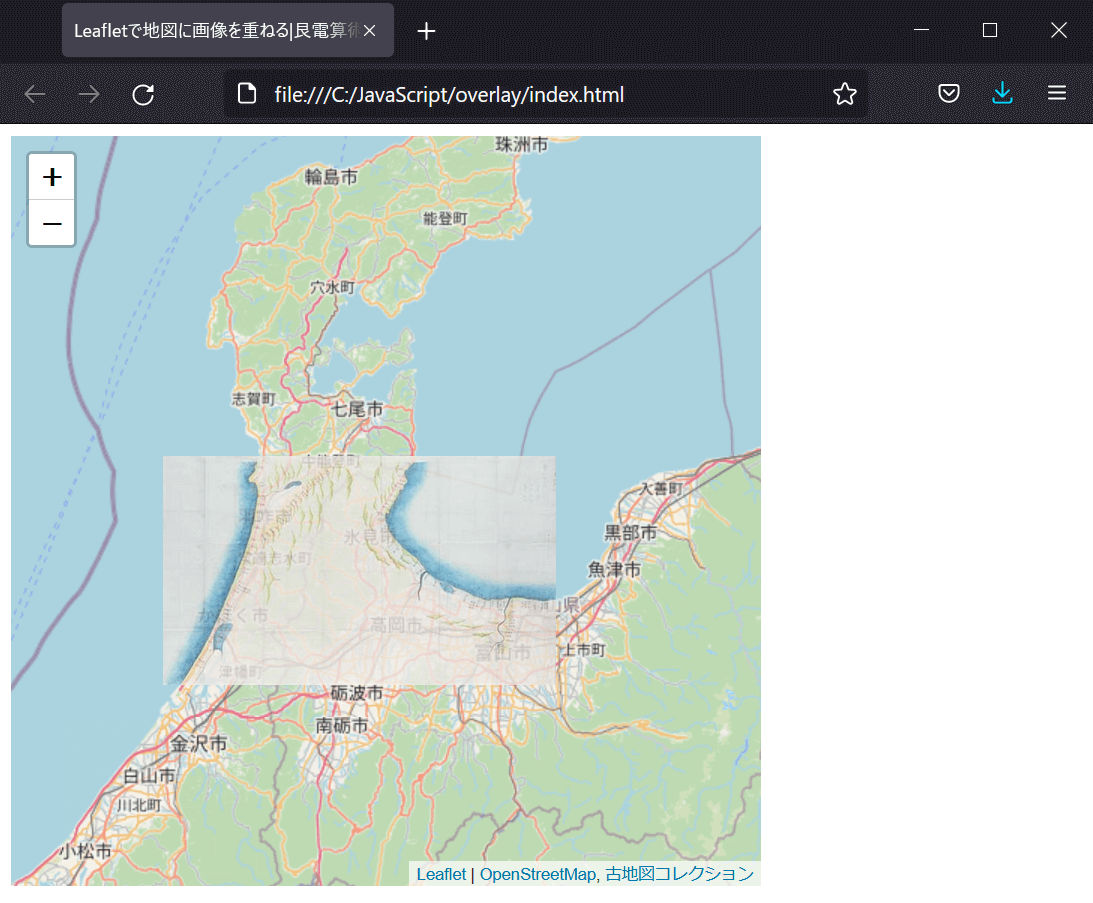
Leafletで地図に画像を重ねる際には、imageOverlayを用いる。
サンプルコードでは、表示する画像を変数image_url, 表示する範囲をboundsに格納した。
表示範囲は緯度経度により指定されているので、地図を移動または拡大・縮小した場合、画像も一緒に変形される。
重ねた画像を透過させる
表示結果

コード(変更点のみ)
// 画像を重ねる
L.imageOverlay(image_url, bounds, {
    attribution: "<a href='https://kochizu.gsi.go.jp/items/376'>古地図コレクション</a>",
    opacity: 0.8,
}).addTo(map);
解説
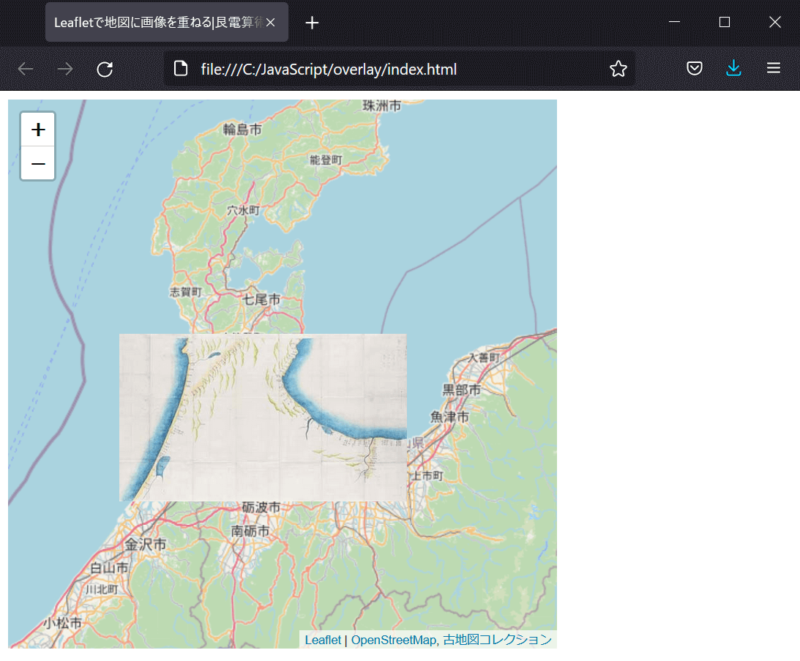
imageOverlay内でopacity(透過率)を設定すると、画像を透過させることができる。
感想
伊能図の精度が高くてびっくりしました(小並感)
Comments