
Calculating the 95% confidence interval for the AUC of the ROC curve allows one to infer the range of values that the AUC would take from the results of data obtained 'by chance'.
Confidence intervals are therefore always presented in scientific papers.
This article describes how to find the 95% confidence interval of the ROC-AUC and shows how the calculation can be implemented by the Python language.
Online automatic calculations
The AutoCalc automatic calculation web application of Ushitora Lab. allows you to calculate confidence intervals for possible AUC values of ROC curves online based on the method described in this article.

Various other calculation functions are available for you to try out!
What is ROC-AUC?
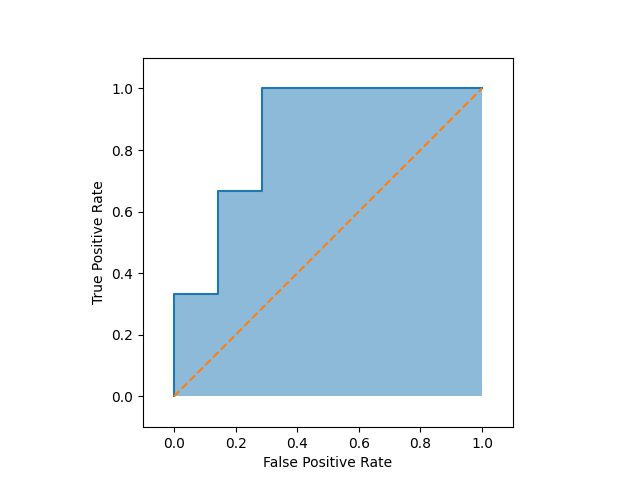
ROC Curve (Receiver Operating Characteristic Curve) is a method of examining the classification performance of a test by plotting the trade-off between the sensitivity of the test (true positive rate) and the false positive rate.
The area under the curve is called the AUC and a test can be considered excellent if the AUC of the ROC curve (ROC-AUC) exceeds approximately 0.8.
The nature of the ROC curve and how it is used in conjunction with the PR curve is described in more detail in the following article.

Confidence interval for ROC-AUC
What is confidence interval?
Confidence Interval (CI) is defined in principle as,
Repeated sampling from a population that follows a normal distribution, each time calculating the interval in a certain way.
When x% of the multiple intervals obtained at this time contain the population mean within the interval,
the interval obtained by this method is called the x% confidence interval.
However, outside of situations such as writing a statistics paper, it may be easier to think of it in a simpler way.
The 95% confidence interval of the ROC-AUC, which is the subject of this article, should be used as an indicator to mean that the ROC-AUC is roughly around this value.
Formula for confidence interval of ROC-AUC
The value of the ROC-AUC calculated from the data obtained is written as \(A\) .
Also, write the standard error of \(A\) as \(\mathrm{SE}(A)\) (the calculation method is shown later).
In this case, the x% confidence interval of the ROC-AUC \(C(x)\) is,
$$C(x)=A\pm z\left(\frac{1-x}{2}\right)\mathrm{SE}(A)$$.
Here, \(z(a)\) is a function that returns the upper a% point of the normal distribution.
When determining the 95% confidence interval ( \(x=0.95\) ), which is often used as a reference in statistics, from the normal distribution table, we can use
$$z\left(\frac{1-x}{2}\right)=z(0.025)=1.96$$
and therefore,
$$C(x)=A\pm 1.96\mathrm{SE}(A)$$
can be obtained.
Standard error of ROC-AUC
\(\mathrm{SE}(A)\) used in the confidence interval formula, according to Hanley et al. (1982), can be calculated as
$$\mathrm{SE}(A)=\sqrt{\frac{A(1-A)+(n_P-1)(Q_1-A^2)+(n_N-1)(Q_2-A^2)}{n_P\cdot n_N}}$$.
where \(n_P,n_N\) is, respectively, of the data,
- \(n_P\): The number of people who should have truly positive results (= e.g. the number of people sick)
- \(n_N\): The number of people who should have truly negative results (i.e. healthy)
These will be referred to as positive samples and negative samples from now on.
\(Q_1,Q_2\) is a probability value calculated from the test that produced the ROC curve.
- \(Q_1\):The probability that when two positive samples are randomly selected, both will be judged "more strongly suspected positive" by the test than one negative sample randomly selected.
- \(Q_2\): The probability that when two negative samples are randomly selected, both of them will be judged "strongly suspected negative" by the test than one positive sample randomly selected.
Hanley and McNeil showed us that these two probabilities can be calculated as
$$Q_1=\frac{A}{2-A}$$
$$Q_2=\frac{2A^2}{1+A}$$
Implementation in Python
Following the above theory, a programme to calculate the 95% confidence interval of the ROC-AUC is implemented in Python.
The variables in the code have the following meanings.
y_true: an array of labels recording whether the data are positive or negative samples.y_score: an array of positive probabilities that the test has determined for the data.- Example: the value of the test value, etc.
positive: the letter of the label representing a positive example- Default settings assume positive =
1, negative =0.
- Default settings assume positive =
The following code calculates the ROC curve using functions from the sklearn library and simultaneously outputs the 95% confidence interval of the ROC-AUC.
Reference
[1] J. A. Hanley and B. J. McNeil. The Meaning and Use of the Area under a Receiver Operating Characteristic (ROC) Curve. Radiology, 1982.
Comments